Best Target Market Research Tools
Are you struggling to identify and reach your ideal customers? Unlocking the secrets of your target market is crucial for business success, but gathering the right data can be challenging. Fear not! In this article, we’ll unveil the best target market research tools that will empower you with valuable insights. From understanding customer preferences to uncovering hidden opportunities, these tools will revolutionize how you connect with your audience. Get ready to level up your marketing game and achieve remarkable results with these cutting-edge target market research tools…
Importance of Target Market Research
The significance of target market research cannot be overstated. Knowing your audience allows you to connect with them on a deeper level, fostering brand loyalty and customer retention. Here are some key reasons why target market research is essential:
- Precise Customer Understanding: Conducting research enables businesses to identify their most valuable customers, understanding their demographics, lifestyles, buying habits, and pain points. This knowledge helps in crafting targeted marketing campaigns that effectively communicate the brand’s message and resonate with the intended audience.
- Improved Product Development: By analyzing the needs and preferences of the target market, businesses can develop products or services that align with customer demands. This customer-centric approach often leads to higher levels of satisfaction, positive reviews, and increased sales.
- Competitive Edge: Understanding your target market gives you a competitive advantage by identifying gaps in the market and finding ways to address them better than competitors. This allows businesses to differentiate themselves and offer unique value propositions.
- Resource Optimization: Market research helps allocate resources more efficiently by focusing efforts on the most promising market segments. This prevents waste of time and money on pursuing audiences that may not be receptive to the offerings.
Overview of the Article
This article aims to explore the critical role of target market research in modern business strategies, highlighting the importance of understanding customers and market dynamics. It will delve into the various aspects of target market research, including the methods and technologies used to gather data, the benefits it offers to businesses, and how it contributes to a competitive edge in the marketplace.
Moreover, the article will focus on the pivotal role of technology in shaping the landscape of market research. From data collection to analysis and the use of AI and machine learning, technology has significantly influenced the way businesses approach and implement their market research efforts.
By the end of this article, readers will have a clear understanding of why target market research is a vital component of successful business strategies and how embracing technology can enhance decision-making processes and overall effectiveness in a highly competitive market environment.
1. Primary Research Tools
When conducting target market research, one of the most effective ways to gather direct and specific information from the audience is through primary research. Primary research involves collecting data firsthand, directly from the source. In this section, we will explore some popular primary research tools, particularly focusing on surveys and questionnaires as a means to gather valuable insights from the target market.
A. Surveys and Questionnaires
Surveys and questionnaires are structured data collection tools that allow businesses to obtain quantitative and qualitative information from respondents. They can be conducted through various channels, including online platforms, emails, in-person interviews, or phone calls. Here are three widely used online tools for creating surveys and questionnaires:
I. Google Forms:
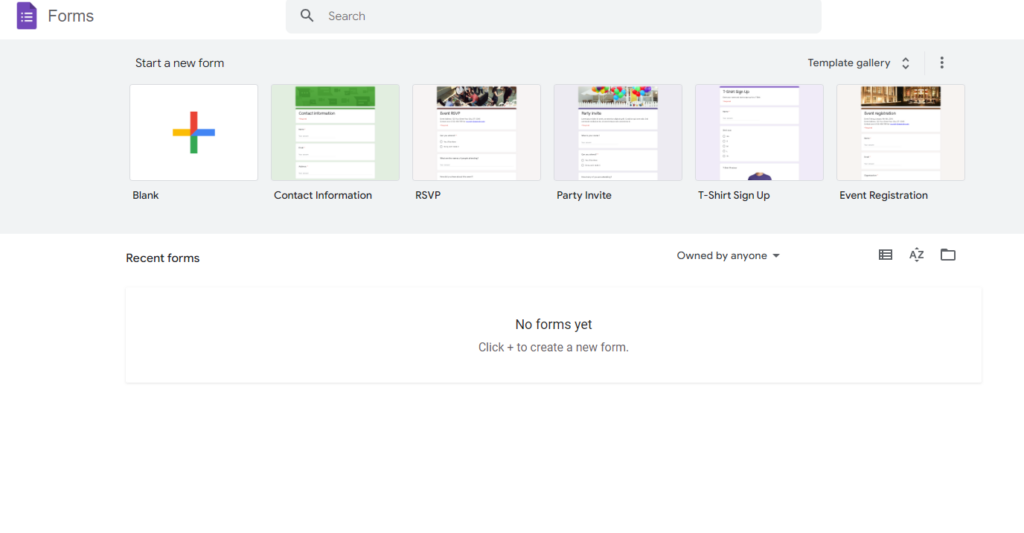
Google Forms is a free and user-friendly tool provided by Google that allows users to create customized surveys and questionnaires. With a wide range of question types, such as multiple-choice, short-answer, and rating scales, Google Forms enables businesses to gather diverse responses from their target audience. The data collected can be automatically organized into charts and graphs, making it easy to analyze and interpret the results.
Key Features of Google Forms:
- Simple and intuitive interface for creating surveys.
- Real-time collaboration for multiple users to work on the same survey simultaneously.
- Easy sharing options through email, social media, or website embedding.
- Data is automatically captured in Google Sheets for convenient data analysis.
II. SurveyMonkey:
SurveyMonkey is one of the most popular online survey platforms, offering a comprehensive set of features for creating and distributing surveys. It provides a range of templates and question types, as well as advanced survey logic and skip logic options. SurveyMonkey’s extensive reporting and analysis tools allow businesses to gain deep insights into the responses received.
Key Features of SurveyMonkey:
- Customizable survey templates tailored to various industries and purposes.
- Advanced survey logic for creating dynamic and personalized question paths.
- Integration with other tools like CRM software and data analysis platforms.
- Extensive data analysis and reporting features for in-depth insights.
III. Typeform:
Typeform stands out for its interactive and visually engaging survey designs. It allows businesses to create conversational surveys with a user-friendly and aesthetically pleasing interface. Typeform’s unique approach to presenting questions one at a time, rather than overwhelming respondents with a long list of questions, enhances user experience and increases response rates.
Key Features of Typeform:
- Conversational and interactive survey format.
- Easy integration with third-party apps and services.
- Mobile-friendly design for optimal survey experience on various devices.
- Real-time reporting for immediate access to survey results.
B. Focus Groups and Interviews
Focus groups and interviews are qualitative research methods that allow businesses to gain in-depth insights into the attitudes, opinions, and behaviors of their target market. These methods involve direct interaction with participants, providing a deeper understanding of their thoughts and feelings. With advancements in technology, conducting focus groups and interviews remotely has become more accessible and efficient. Here are three widely used platforms for remote focus groups and interviews:
I. Zoom:
Zoom has emerged as a popular choice for remote meetings, including focus groups and interviews. Its video conferencing capabilities facilitate face-to-face interactions, enabling researchers to read body language and facial expressions. Zoom’s screen-sharing feature also allows researchers to present stimuli, such as product prototypes or marketing materials, to participants in real time.
Key Features of Zoom:
- High-quality video and audio for seamless communication.
- Screen-sharing for interactive presentations.
- Breakout rooms for smaller group discussions during focus groups.
- Recording option to review the session later and capture valuable insights.
II. Skype:
Skype has long been a staple for online communication and remains a valuable tool for remote interviews and focus groups. With its instant messaging, voice, and video calling features, Skype enables researchers to conduct interviews one-on-one or host small focus groups. Additionally, Skype’s call recording feature allows researchers to review the discussions and analyze responses more thoroughly.
Key Features of Skype:
- Voice and video calling for real-time interactions.
- Instant messaging for text-based interviews or follow-up communication.
- A group calling for small focus groups.
- Call recording for post-analysis and review.
III. GoToMeeting:
GoToMeeting is designed specifically for online meetings and virtual collaboration, making it well-suited for remote focus groups and interviews. Its platform offers various interactive features like screen sharing, live chat, and the ability to conduct polls during the session. Researchers can use these tools to engage participants actively and gather valuable feedback.
Key Features of GoToMeeting:
- Web-based video conferencing for easy access.
- Interactive features like polls and live chat for engagement.
- Robust security and privacy settings for confidential discussions.
- Recording functionality to revisit discussions and extract insights.
C. Observational Research
Observational research is a valuable method used by businesses and researchers to study and analyze individuals’ behaviors, actions, and interactions in their natural environment. Unlike surveys or interviews, observational research does not rely on self-reported data but instead focuses on directly observing and recording real-life situations. This approach provides unique insights into consumer behavior, preferences, and decision-making processes. In recent years, advancements in technology have significantly enhanced observational research methods. Here are three notable technologies used in observational research:
I. Eye-tracking Technology:
Eye-tracking technology is a powerful tool that measures and records eye movements to determine where individuals focus their attention. This technology uses specialized hardware, such as eye-tracking glasses or sensors, to track the movement of a person’s eyes as they view various stimuli, such as advertisements, product packaging, websites, or digital interfaces. The data collected from eye-tracking studies offer valuable insights into what elements capture people’s attention and the patterns they follow when viewing visual content.
Key Applications of Eye-tracking Technology:
- Advertising and Marketing: Eye-tracking studies help advertisers and marketers understand which elements of an advertisement or website attract the most attention, allowing them to optimize designs for better engagement and conversion rates.
- User Experience (UX) Design: UX designers use eye-tracking data to identify areas of interest and identify potential usability issues on websites and digital products, leading to more user-friendly interfaces.
- Retail Environments: Eye-tracking studies in retail environments help retailers optimize store layouts and product placements to increase customer engagement and sales.
II. Heat Maps and Clickstream Analysis:
Heat maps and clickstream analysis are digital tools used to analyze user interactions with websites and digital interfaces. Heat maps visually represent data by using color-coded overlays that indicate the areas of a webpage or app that receive the most clicks or engagement (hot spots) and those that receive less attention (cold spots). Clickstream analysis, on the other hand, tracks and records users’ digital interactions, such as mouse movements, clicks, and scrolling behavior.
Key Applications of Heat Maps and Clickstream Analysis:
- Website Optimization: Heat maps and clickstream analysis help website owners and designers understand user behavior, identify popular sections, and detect potential usability issues for better optimization.
- E-commerce: Retailers use these tools to analyze user engagement with product pages, identify points of interest, and optimize the shopping experience for higher conversion rates.
- App Design: App developers leverage heat maps and clickstream analysis to improve the user experience and identify any navigation issues.
III. Video Recording Software:
Video recording software is a fundamental technology in observational research, capturing real-life interactions between consumers and products or services. Observers can record participants’ actions, facial expressions, and verbal feedback as they engage with a product, service, or environment.
Key Applications of Video Recording Software:
- Usability Testing: Video recording software is commonly used in usability testing to observe how users interact with prototypes or products, allowing designers to identify pain points and areas for improvement.
- Market Research: Researchers use video recording to analyze consumer behavior during focus groups, interviews, or real-world scenarios, providing valuable insights for marketing strategies and product development.
2. Secondary Research Tools
In the world of market research, secondary research plays a vital role in gathering valuable insights and understanding the competitive landscape. Unlike primary research which involves collecting data firsthand, secondary research relies on existing sources of information, such as reports, databases, and publications. In this section, we will explore three powerful secondary research tools that are particularly valuable for competitor analysis:
A. Competitor Analysis
Competitor analysis is an essential component of market research, helping businesses understand their rivals’ strengths, weaknesses, and strategies. By examining competitors’ online presence, marketing efforts, and performance metrics, companies can identify opportunities and make informed decisions. The following tools are commonly used for competitor analysis:
I. SEMrush:
SEMrush is an all-in-one digital marketing toolkit designed to provide comprehensive competitor analysis and insights. It offers various features, including keyword research, organic and paid traffic analysis, backlink analysis, and more. SEMrush allows businesses to monitor their competitors’ search engine rankings, ad campaigns, and social media performance. With its user-friendly interface and detailed reports, businesses can uncover valuable data to refine their own marketing strategies.
Key Features of SEMrush:
- Domain Analytics: Analyze competitor websites to discover top-performing organic and paid keywords, traffic sources, and backlink profiles.
- Keyword Research: Identify relevant keywords and search volumes to optimize SEO and PPC campaigns.
- Advertising Research: Gain insights into competitor ad strategies and budget allocation in different advertising channels.
- Social Media Tracking: Monitor competitors’ social media presence and performance across various platforms.
II. SimilarWeb:
SimilarWeb is a powerful tool for competitor analysis that provides comprehensive website traffic data and audience insights. It offers valuable information on competitor website traffic, sources of traffic, user engagement, and audience demographics. SimilarWeb’s data visualization and reporting features help businesses understand market trends, identify industry benchmarks, and benchmark their own performance against competitors.
Key Features of SimilarWeb:
- Website Traffic Analysis: Obtain detailed traffic data for competitor websites, including total visits, traffic sources, and popular referring sites.
- Audience Insights: Understand the demographics, interests, and browsing behavior of competitor website visitors.
- Industry Benchmarks: Compare website performance metrics against industry averages for a broader perspective.
III. Ahrefs:
Ahrefs is a comprehensive SEO toolset primarily used for backlink analysis and keyword research. It helps businesses uncover their competitors’ backlink profiles, find new link-building opportunities, and analyze the SEO strategies of rival websites. With its vast database of indexed web pages, Ahrefs provides valuable insights into the organic search visibility of competitors.
Key Features of Ahrefs:
- Backlink Analysis: Examine the backlink profiles of competitors to identify link-building opportunities and understand their link-building strategies.
- Keyword Research: Discover organic and paid keywords that competitors are targeting to improve your own SEO and PPC efforts.
- Content Analysis: Identify top-performing content pieces of competitors to gain inspiration for your content marketing strategy.
B. Social Media Listening and Monitoring
Social media has become an integral part of people’s lives, and it also plays a crucial role in shaping businesses’ success. Social media listening and monitoring tools are designed to help businesses keep a pulse on what their audience is saying about them, their competitors, and industry trends. By analyzing social media conversations, sentiments, and engagement, companies can gain valuable insights to inform their marketing strategies, improve customer experiences, and enhance brand reputation. Here are three popular social media listening and monitoring tools:
I. Hootsuite:
Hootsuite is a comprehensive social media management platform that offers social media listening and monitoring features. It allows businesses to monitor social media channels, engage with their audience, and schedule posts across multiple platforms from a single dashboard. Hootsuite’s listening capabilities enable users to track brand mentions, industry keywords, and trending topics, providing real-time insights into what’s happening in the social media sphere.
Key Features of Hootsuite:
- Social Media Monitoring: Track mentions, hashtags, and keywords relevant to the brand or industry to identify trends and monitor brand sentiment.
- Sentiment Analysis: Analyze the sentiment of social media mentions to gauge how audiences feel about the brand or specific topics.
- Customizable Dashboards: Create customized dashboards to view social media analytics and conversations from different platforms in one place.
- Social Media Scheduling: Schedule and publish content on various social media channels at optimal times for maximum reach and engagement.
II. Mention:
Mention is a powerful social media monitoring tool that helps businesses track brand mentions, monitor competitor activities, and analyze industry trends in real time. It provides comprehensive insights into online conversations, enabling businesses to understand how their brand is perceived and identify potential crises or opportunities. Mention’s user-friendly interface and customizable alerts make it easy for businesses to stay on top of their social media presence.
Key Features of Mention:
- Brand Monitoring: Monitor brand mentions across social media, websites, news articles, and blogs to track brand reputation and identify brand advocates and influencers.
- Competitive Analysis: Track competitor mentions and activities to gain insights into their social media strategies and performance.
- Real-time Alerts: Set up custom alerts to receive notifications when specific keywords or brand mentions are mentioned online.
- Sentiment Analysis: Measure the sentiment of mentions to understand the overall sentiment of conversations related to the brand.
III. Brandwatch:
Brandwatch is an advanced social media listening and analytics tool that provides in-depth insights into social media conversations. It offers sophisticated data visualization, sentiment analysis, and customizable reports to help businesses extract actionable insights from social media data. Brandwatch’s AI-driven features enable users to identify emerging trends and sentiments in real-time, empowering businesses to make data-driven decisions.
Key Features of Brandwatch:
- Social Listening: Monitor social media conversations to understand audience sentiment, track brand mentions, and identify industry trends.
- Image Analysis: Analyze images and visuals shared on social media to gauge brand sentiment and customer experiences.
- Audience Analysis: Gain insights into the demographics, interests, and behavior of the target audience on social media.
- Data Visualization: Create customizable, visually appealing reports and dashboards to present social media data effectively.
C. Consumer Behavior and Analytics
Understanding consumer behavior is essential for businesses to tailor their products, services, and marketing strategies effectively. Consumer behavior analytics tools help companies gather data on customer interactions, preferences, and buying patterns to gain valuable insights. By analyzing this data, businesses can make data-driven decisions, optimize customer experiences, and maximize sales. Here are three prominent consumer behavior analytics tools:
I. Google Analytics:
Google Analytics is one of the most widely used web analytics tools, provided by Google. It offers a comprehensive set of features to track and analyze website traffic and user behavior. By implementing a tracking code on their website, businesses can gain valuable insights into user interactions, traffic sources, conversions, and more.
Key Features of Google Analytics:
- Website Traffic Analysis: Understand how users find and navigate through the website, which pages they visit, and how long they stay.
- Goal Tracking: Set up and track specific goals, such as completing a purchase or filling out a contact form, to measure conversions and success.
- E-commerce Tracking: For online businesses, Google Analytics allows tracking of product sales, revenue, and performance metrics for individual products.
- Audience Insights: Learn about the demographics, interests, and behaviors of website visitors to better target marketing efforts.
II. Mixpanel:
Mixpanel is a powerful analytics platform focused on user behavior and engagement. Unlike traditional web analytics tools, Mixpanel offers event-based tracking, enabling businesses to analyze specific user interactions and actions within their digital products or applications.
Key Features of Mixpanel:
- Event Tracking: Monitor and analyze user interactions, such as clicks, sign-ups, and in-app actions, to understand user behavior and engagement.
- Funnel Analysis: Create funnels to track how users progress through specific processes, such as the onboarding flow or checkout process, to identify drop-offs and optimize conversions.
- Retention Analysis: Measure user retention rates over time and identify factors that contribute to user retention or churn.
- Segmentation: Segment users based on specific criteria to analyze the behavior of different user groups and tailor marketing strategies accordingly.
III. Kissmetrics:
Kissmetrics is a behavioral analytics and engagement platform designed to help businesses understand customer interactions across various touchpoints. It focuses on providing insights into customer journeys and lifetime value, enabling businesses to optimize their marketing efforts and customer experiences.
Key Features of Kissmetrics:
- Customer Journey Tracking: Analyze individual customer journeys and interactions with the brand to identify key touchpoints and pain points.
- Cohort Analysis: Group customers into cohorts based on specific characteristics or actions to compare behavior and measure retention and engagement over time.
- Customer Lifetime Value (CLV): Measure the long-term value of customers to identify the most valuable segments and inform acquisition and retention strategies.
- A/B Testing: Run A/B tests to compare the performance of different variations of marketing campaigns or website elements.
3. Demographic and Psychographic Research Tools
Demographic and psychographic research tools are valuable resources for businesses seeking to understand their target audience on a deeper level. Demographic research focuses on gathering data related to the characteristics and traits of a population, such as age, gender, income, education, and location. On the other hand, psychographic research delves into the attitudes, interests, values, and lifestyle preferences of individuals. By combining demographic and psychographic insights, businesses can create more targeted marketing strategies and tailor their offerings to meet the specific needs and desires of their audience. Here are three notable demographic and psychographic research tools:
A. Quantcast:
Quantcast is a digital advertising and audience measurement platform that provides valuable demographic and psychographic data on website visitors and mobile app users. The platform uses machine learning algorithms to analyze anonymized user data and generate audience insights, including demographics, interests, online behaviors, and purchase intentions.
Key Features of Quantcast:
- Audience Insights: Gain detailed demographic information on website visitors, such as age, gender, income, education, and household composition.
- Interest Segmentation: Understand the interests and affinities of your audience to create targeted content and advertising campaigns.
- Behavior Analysis: Analyze user behavior on your website to identify popular content, navigation patterns, and areas for improvement.
- Custom Audience Targeting: Use Quantcast data to target specific audience segments with personalized advertisements.
B. Nielsen MyBestSegments:
Nielsen MyBestSegments is a market segmentation tool that classifies neighborhoods and regions in the United States based on demographic and lifestyle data. By combining consumer behavior, buying preferences, and socio-economic characteristics, the tool creates distinct consumer segments, allowing businesses to understand their target markets better.
Key Features of Nielsen MyBestSegments:
- Market Segmentation: Identify different consumer segments in specific geographic areas based on shared demographic and psychographic characteristics.
- Lifestyle Insights: Gain insights into the interests, values, and activities of each segment to tailor marketing messages and product offerings.
- Geographic Targeting: Use the tool to target specific areas with relevant marketing campaigns based on the characteristics of the local population.
C. YouGov Profiles:
YouGov Profiles is an audience profiling tool that provides comprehensive psychographic data on consumer behavior and attitudes. It collects data through online surveys and creates detailed profiles of various audience segments, offering businesses a deep understanding of their customer’s preferences and interests.
Key Features of YouGov Profiles:
- Psychographic Insights: Access detailed information on consumer attitudes, interests, lifestyle choices, and brand preferences.
- Brand Affinity: Analyze consumers’ affinity towards specific brands and understand their loyalty and likelihood of brand advocacy.
- Segmentation Analysis: Segment audiences based on various psychographic criteria, helping businesses tailor marketing messages and target specific consumer groups effectively.
4. Data Visualization and Reporting Tools
Data visualization and reporting tools are essential for transforming raw data into meaningful insights that can be easily understood and communicated. These tools help businesses create visually appealing and interactive charts, graphs, and dashboards to present complex data in a clear and engaging manner. This enables stakeholders to make informed decisions based on the data analysis. Here are three prominent data visualization and reporting tools:
A. Tableau:
Tableau is a leading data visualization and business intelligence platform that empowers users to create interactive and dynamic visualizations. With its drag-and-drop interface, users can easily connect to various data sources, import data, and build insightful dashboards. Tableau offers a wide range of visualization options, from basic charts to complex interactive graphics, making it a versatile tool for data exploration and analysis.
Key Features of Tableau:
- Interactive Dashboards: Create interactive dashboards with drill-down and filtering capabilities to explore data in real-time.
- Data Connection: Connect to various data sources, such as Excel, databases, and cloud-based platforms, for seamless data integration.
- Collaboration: Share dashboards and insights with team members for collaborative decision-making.
- Advanced Analytics: Utilize advanced statistical and forecasting functions for deeper data analysis.
B. Google Data Studio:
Google Data Studio is a free and user-friendly data visualization tool that integrates seamlessly with other Google products, such as Google Analytics and Google Sheets. It allows users to create customizable reports and dashboards with real-time data, providing a clear and dynamic view of key performance metrics.
Key Features of Google Data Studio:
- Data Integration: Connect to various data sources, including Google products and other third-party platforms, to gather relevant data.
- Customizable Templates: Choose from a wide range of pre-designed templates or create custom visualizations to suit specific reporting needs.
- Real-time Collaboration: Collaborate with team members in real-time to build and edit reports together.
- Sharing and Publishing: Share reports and dashboards with stakeholders, clients, or team members, and control the level of access.
C. Infogram:
Infogram is a data visualization tool that specializes in creating interactive infographics, charts, and maps. It offers a simple and intuitive interface for users to design visually compelling data presentations without the need for extensive technical skills.
Key Features of Infogram:
- Infographic Creation: Design interactive infographics and visual stories to present data in a compelling and engaging format.
- Chart Customization: Create various charts, graphs, and maps with extensive customization options for colors, fonts, and styles.
- Data Import: Import data from spreadsheets or other data sources to generate dynamic visualizations.
- Real-time Updates: Automatically update data visualizations when the underlying data changes, ensuring accuracy in real-time reporting.
5. Emerging Technologies and AI-Powered Tools
As technology continues to advance, emerging technologies and AI-powered tools are revolutionizing the way businesses gather insights and understand consumer behavior. These tools leverage artificial intelligence and machine learning algorithms to process vast amounts of data, extract meaningful patterns, and provide valuable consumer insights. Here are two prominent examples of emerging technologies and AI-powered tools:
A. Sentiment Analysis Tools:
Sentiment analysis, also known as opinion mining, is a natural language processing technique that identifies and analyzes the sentiment expressed in textual data, such as social media posts, customer reviews, and survey responses. AI-powered sentiment analysis tools help businesses understand the public’s perception of their brand, products, and services, as well as monitor sentiment trends over time.
Key Features of Sentiment Analysis Tools:
- Sentiment Detection: Automatically identify and categorize text as positive, negative, or neutral sentiment.
- Entity Recognition: Identify and extract entities mentioned in the text, such as brand names, products, or people.
- Topic Modeling: Group related texts into topics to gain insights into the most discussed themes.
- Real-time Monitoring: Continuously monitor social media and online platforms to capture sentiment changes and respond promptly to customer feedback.
B. AI-Driven Consumer Insights Platforms:
AI-driven consumer insights platforms leverage artificial intelligence and machine learning to process large-scale consumer data from various sources. These platforms provide businesses with deep consumer insights, allowing them to understand preferences, behaviors, and trends in real-time. By analyzing massive datasets, AI-driven consumer insights platforms help businesses make data-driven decisions and deliver personalized experiences to their target audience.
Key Features of AI-Driven Consumer Insights Platforms:
- Predictive Analytics: Use historical data and machine learning models to predict consumer behavior and preferences.
- Personalization: Provide personalized recommendations and content based on individual preferences and behavior.
- Trend Analysis: Identify emerging trends and consumer preferences to stay ahead in the market.
- Customer Segmentation: Group consumers into distinct segments based on behavior, interests, and demographics for targeted marketing.
6. Integrating Multiple Tools for Comprehensive Research
In modern research and business intelligence, using a single tool may not provide a complete and accurate picture of the complex and diverse data landscape. Integrating multiple tools is crucial to achieving comprehensive research and gaining deeper insights into various aspects of the target market, consumer behavior, and industry trends. Two essential components of integrating multiple tools for comprehensive research are data aggregation and cross-platform data analysis:
A. Data Aggregation and Integration:
Data aggregation and integration involve gathering and combining data from different sources and tools into a unified dataset for analysis. This process allows researchers to have a holistic view of the market, eliminating data silos and providing a more comprehensive understanding of the subject under study. By integrating data from various tools, businesses can connect the dots between different data points, making more informed decisions and uncovering valuable insights.
Key Steps in Data Aggregation and Integration:
- Identify Relevant Data Sources: Determine which tools and platforms contain valuable data related to your research objectives.
- Data Collection and Standardization: Gather data from each source and ensure that it is in a consistent and compatible format for integration.
- Data Cleaning and Preprocessing: Remove duplicates, handle missing data, and perform necessary transformations to prepare the data for analysis.
- Data Integration: Combine data from different sources into a single dataset using data integration tools or platforms.
B. Analyzing Cross-Platform Data:
Cross-platform data analysis involves examining data collected from various tools and platforms to identify patterns, correlations, and trends. This type of analysis enables businesses to understand the interconnections between different channels and touchpoints that influence consumer behavior and decision-making.
Key Steps in Analyzing Cross-Platform Data:
- Data Visualization: Use data visualization tools to create interactive dashboards and reports that provide a comprehensive view of cross-platform data.
- Identify Correlations: Look for correlations and relationships between data points from different sources to gain deeper insights into consumer behavior and preferences.
- Customer Journey Analysis: Analyze the customer journey across various platforms to understand the touchpoints that impact the conversion process.
- Campaign Performance: Assess the performance of marketing campaigns across different channels to optimize marketing efforts effectively.
Importance of Comprehensive Research:
Integrating multiple tools for comprehensive research is essential for businesses and researchers seeking a holistic understanding of their target market and audience. By combining data from various sources and platforms, businesses can identify connections, patterns, and opportunities that may not be apparent when analyzing data in isolation. Comprehensive research enables businesses to make more accurate predictions, devise data-driven strategies, and deliver personalized experiences that resonate with their audience.
Ethical Considerations in Target Market Research
Ethical considerations are of utmost importance when conducting target market research. As businesses gather and analyze data to understand their audience better, it is essential to prioritize data privacy, informed consent, and anonymity to protect the rights and welfare of the individuals involved. Here are three crucial ethical considerations in target market research:
A. Data Privacy and Security:
Data privacy and security are paramount when collecting and storing personal information about individuals. It is essential for businesses to adhere to data protection laws and regulations to safeguard the privacy of their customers and respondents. This includes obtaining consent before collecting data, ensuring secure data storage, and using encryption and other security measures to prevent unauthorized access or data breaches.
Key Principles of Data Privacy and Security:
- Informed Consent: Inform participants about the purpose of data collection, how their data will be used, and obtain their consent before gathering any personal information.
- Data Minimization: Only collect the necessary data that is relevant to the research objectives, and avoid unnecessary or excessive data collection.
- Data Storage: Ensure that all data is stored securely and protected from unauthorized access.
- Data Retention: Delete or anonymize personal data when it is no longer needed for the research unless there are legal requirements to retain it.
B. Obtaining Informed Consent:
Obtaining informed consent is a fundamental ethical principle in target market research. It involves providing participants with clear and comprehensive information about the research, its purpose, and how their data will be used. Participants must have the freedom to choose whether they want to participate or not, without facing any pressure or coercion.
Key Elements of Obtaining Informed Consent:
- Clear Communication: Clearly explain the research objectives, methods, potential risks, and benefits to the participants.
- Voluntary Participation: Ensure that participation is entirely voluntary, and participants have the right to withdraw from the study at any time without consequences.
- Consent Forms: Use written consent forms or electronic consent mechanisms to document participants’ agreement to take part in the research.
- Consent for Data Sharing: If data will be shared with third parties, obtain explicit consent from participants for such sharing.
C. Anonymization and De-identification:
Anonymization and de-identification are crucial techniques used to protect the privacy of individuals in target market research. Anonymization involves removing or encrypting any personal identifiers from the data to ensure that individuals cannot be identified. De-identification involves transforming the data in a way that individual identities cannot be linked back to the data.
Key Methods of Anonymization and De-identification:
- Removing Identifiers: Remove or encrypt any personal identifiers such as names, contact information, and identification numbers.
- Aggregation: Aggregate data at a group level to prevent the identification of individual respondents.
- Masking: Replace specific values with general ranges (e.g., age ranges) to prevent identification.
- Randomization: Randomize data points to make it challenging to link data back to individuals.
Conclusion
Unlocking the power of target market research is essential for business success. By understanding your audience, identifying opportunities, and leveraging diverse tools, you can make informed decisions and stay ahead in a constantly evolving marketplace. The future of market research is driven by AI-powered platforms and ethical practices, ensuring deeper insights and data privacy. Embrace these tools, stay ahead of the trends, and build a strong foundation for growth and success in today’s consumer-centric landscape.